ZetaSpin
A Revolution in Zeta Potential Measurement

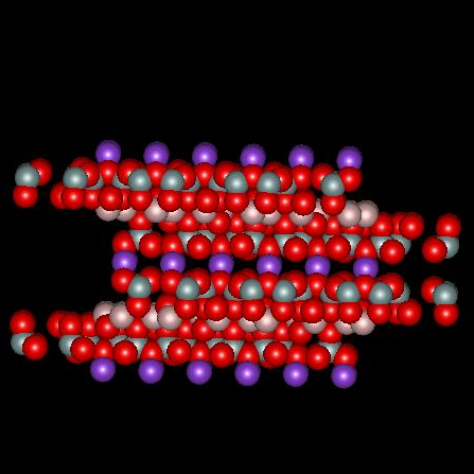
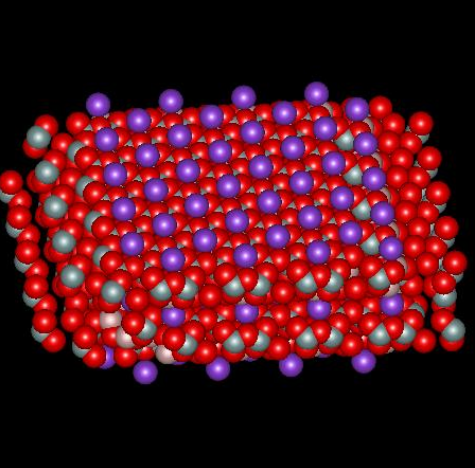
Muscovite mica, a solid compound with formula KAl2(AlSi3O10)(OH)2, is a so-called 2:1 clay mineral because there are two layers of silicon atoms tetrahedrally coordinated by oxygen and one aluminum atom layer octahedrally coordinated by oxygen for every unit cell (called a micelle). The combination produces a structure with a net -1 charge that is neutralized by sheets of potassium ion, one sheet per micelle, located between adjacent micelles. The figures below,1 borrowed with permission from the website of Dr. Robert Harter, emeritus professor of soil chemistry at the University of New Hampshire (see websites at the end of this page), show a side view of the structure and a perspective view of the surface. The purple spheres are potassium ions, the greenish spheres are silicon, the brownish ones are aluminum, and the red ones are oxygen. The perspective view shows well that potassium ions reside on a plane and sit in hexagonal oxygen rings. As it happens, potassium has the perfect size to fit in these rings. The surface site area2 is 0.458 nm2.
When mica is cleaved, i.e. when we use tape to pull off a sheet of it, the surface is effectively neutral. When it comes in contact with solution, potassium ions dissociate from the surface, which leaves unbalanced negative charge on the surface. It is interesting to calculate the charge density on the surface and inquire about what zeta potential corresponds to that surface charge, in a crude sense. If there is one negative charge per 0.458 nm2, the corresponding charge density is -0.35 coulombs per m2. Assume the surface is completely dissociated and there are no adsorbed ions. In this case the charge of the diffuse part of the double layer balances the charge on the surface. The Gouy-Chapman theory gives a relationship between the charge in the diffuse layer and the zeta potential of the surface, where zeta here is taken to be the potential at the Outer Helmholtz Plane.
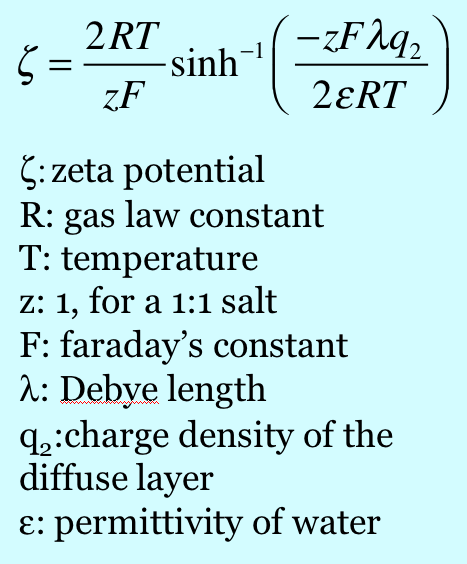
Note the dependence of zeta on the charge density in the diffuse layer and on the Debye length. For a negatively charged surface, which attracts positive shielding charge, the zeta potential is negative. If the charge is held constant and the concentration of ions in the bulk solution is increased (causing a decrease in the Debye length), the zeta potential decreases in magnitude. Thus the magnitude of the zeta potential increases as the charge increases, and it decreases as the ionic strength increases at constant charge. Putting in values for the charge density as per above and the other parameters, one calculates a zeta potential of -270 mV. This value can be compared to values documented in the literature by Scales et al. [Scales90] For example, they measured the zeta potential of mica to be approximately -120 mV in 0.2 mM KCl, thus it seems that there is more to the question of what controls the charge on a mica surface than just the dissociation of potassium ions.
In fact the whole question of what establishes the charge on mineral surfaces is a complicated subject and ground, so to speak, much tilled by everyone from soil scientists to colloid chemists. One model for mica due to Scales et al. [Scales90] and appropriate for the pH range between 5 and 8 is sketched here. They proposed a single site dissociation model for the surface coupled to a three-layer model for the double layer. The three layer model for the double layer comprises a diffuse layer, an outer compact layer between the OHP and the IHP, and an inner compact layer between the solid surface itself and the IHP. Each of these three layers has a capacitance associated with it. The diffuse layer capacitance is given by the GC theory, the inner compact layer capacitance is assigned a high value, and the outer compact layer capacitance is used as a fitting parameter in their model.
The single site dissociation model comprises two equilibria: Let S- represent a singly charged surface site (probably a silicate structure) abandoned by potassium ion upon contact with water. In fact the surface density of free sites S- equals the surface density of charge. The following equilibria are in action in KCl solution:
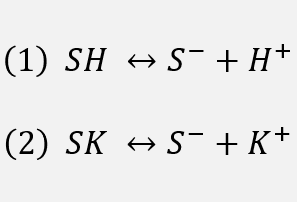
Eq 1 represents the reversible interaction of protons with the surface sites, while eq 2 represents the reversible interaction of potassium ions with the surface sites. Protons and potassium ions neutralize the sites with which they are complexed. As one raises the pH, protons are subtracted from the surface. As one raises the KCl concentration, there are more potassium ions pushing the equilibrium of eq 2 toward complexing of the surface by potassium.
Equations 1 - 3 provide a foundation for interpreting zeta potential data on mica. The charge on the surface, and hence the zeta potential, clearly depend in a complex manner on the environment in which the mica finds itself. And even this is not the whole story. Outside the limits of 4 < pH < 8, other effects can occur. For example other investigators [Lyons81] have found that acid leached aluminum ions from mica and that mica stored in acid solution resembled adopted the electrokinetic characteristics of alumina when the pH was subsequently increased, reflecting deposition of aluminum oxide species on the surface.
See http://pubpages.unh.edu/~harter/crystal.htm and http://pubpages.unh.edu/~harter/muscovite.html for more about the structure of muscovite mica.
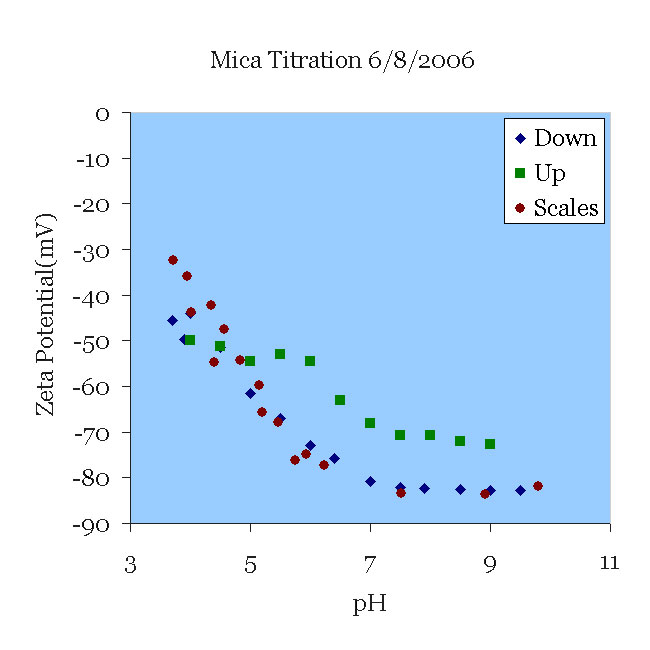
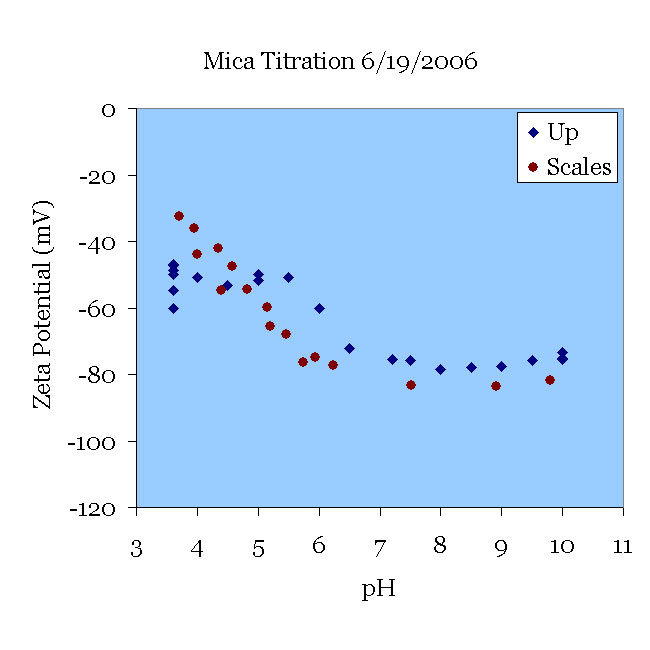
A mica sample that had been titrated the day before was placed in a 100 μS/cm KCl solution (approximately 0.66 mM) and pH 9.5. The solution was titrated from pH 9.5 to pH 3.5 and then from 3.5 to 9 without changing the solution. Note the excellent agreement with the data of [Scales90] for their experiments in 1 mM solution. Note also the deviation from their results as the pH rises. This can probably be traced to two sources. First, the titration itself certainly increased the ionic strength, which tends to decrease the magnitude of zeta. More importantly, perhaps, titration to acid conditions leaches aluminum from the mica, which then might be re-deposited as the pH rises. Now the surface might present alumina oxides to the solution, which have a isoelectric point higher than silica.
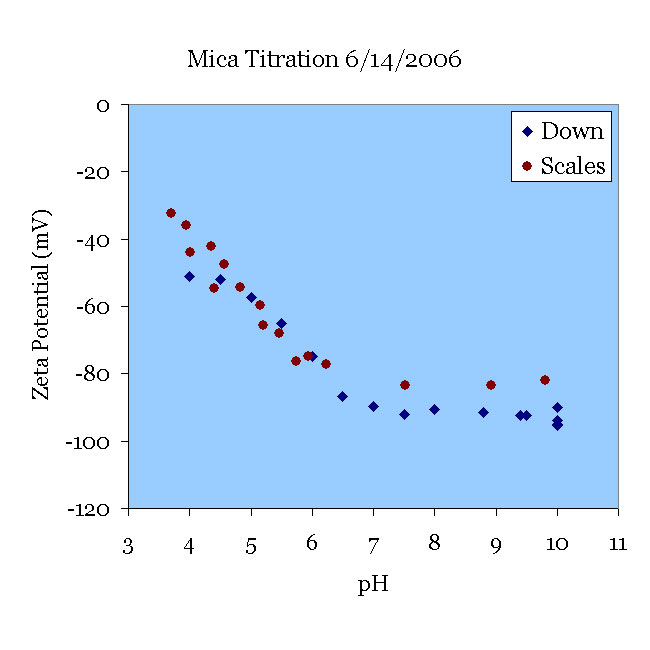
A fresh-cleaved mica sample was pre-treated in pH 10 KOH solution for 30 minutes and tested in 138 μS/cm KCl solution. The solution was titrated from pH 10 to pH 3.5. This ZetaSpin data agrees well with the data of [Scales90] at pH < 6 with some deviation at the higher pH. Fresh samples of mica exhibit somewhat higher zeta potentials until they have been aged overnight in contact with solutions, as one can see from the 08JUN graph above.
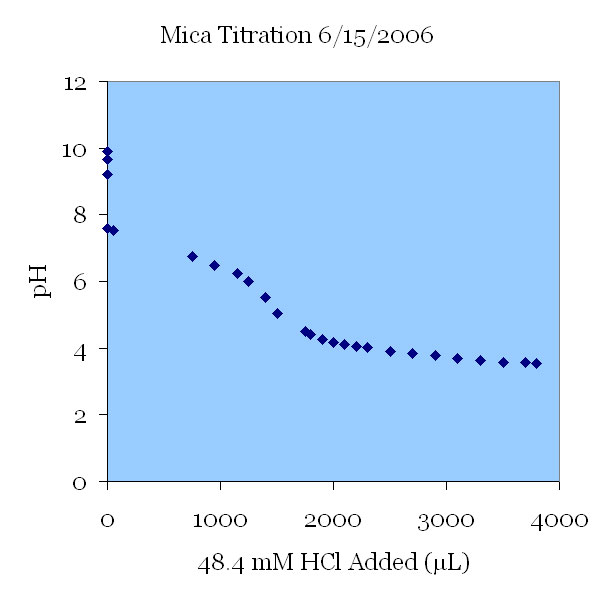
The pH change of a 115 μS/cm KCl solution. The solution was titrated down from pH 10 to a pH of 3.5. The initial change in pH was not caused by the addition of titrant; this pH drop was thought to be the effect of carbon dioxide introduced with air bubbles by the strong stirring action. In the next graph, a nitrogen purge was used to prevent these uncontrolled pH changes.
A fresh mica sample was pretreated in pH 11 KOH solution for 30 minutes and used in a 198 μS/cm KCl solution starting at pH 3.5. The solution was titrated from pH 3.5 to pH 10. Note the deviation from the data of [Scales90] and the similarity to the data of the 08JUN06 experiment once the pH was increased. There is a plateau when 3 < pH < 5 and then a typical increase in the magnitude. See comments to the 08JUN06 results. This experiment successfully used a nitrogen purge to avoid variations in pH due to entrained air bubbles.
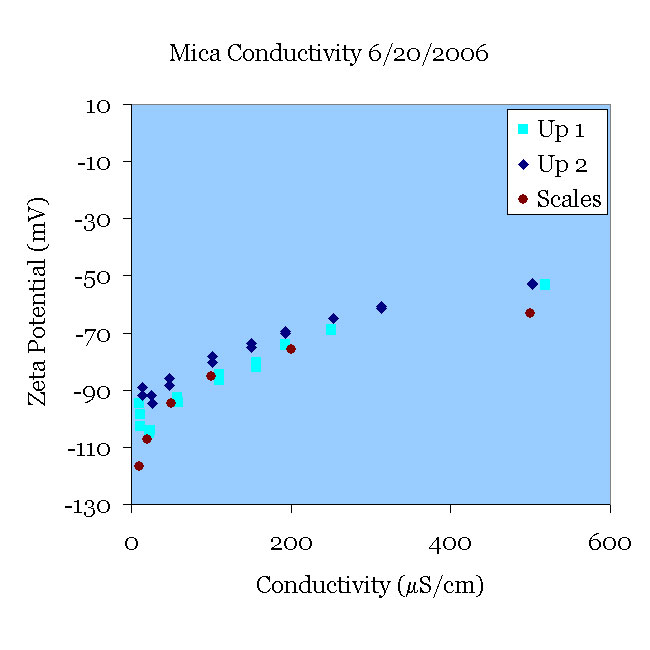
A fresh mica sample was pre-treated in pH 11 solution for 30 minutes and placed in an initially 10 μS/cm KCl solution at pH 5.5. The conductivity of the solution was then increased to 500 μS/cm (Up 1). Using the same mica sample, the procedure was repeated with a fresh solution of KCl (Up 2). Both experiments agree reasonably well with the data of [Scales90].
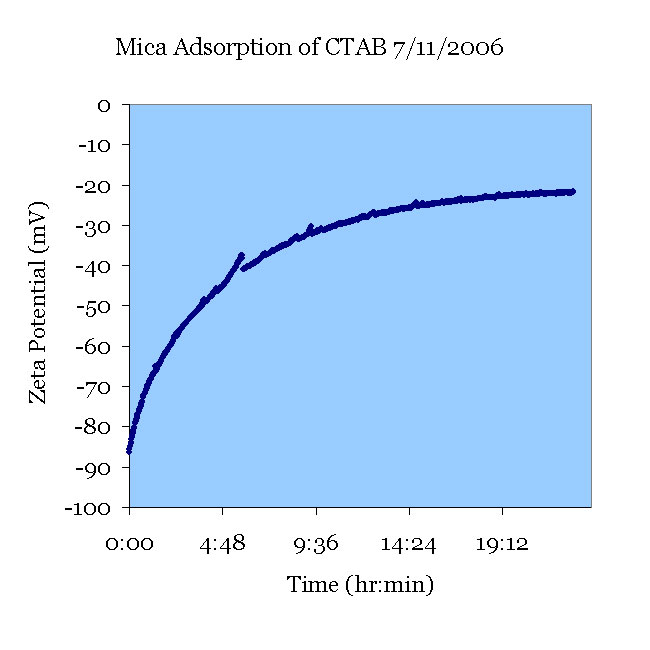
A fresh mica sample was pretreated in pH 11 KOH solution and tested in a 112 μS/cm KCl solution. CTAB was added to create a 1 mM CTAB solution and tested for 24 hours. The zeta potential increased as the CTAB adsorbed. A stable final zeta potential of –22mV was observed.
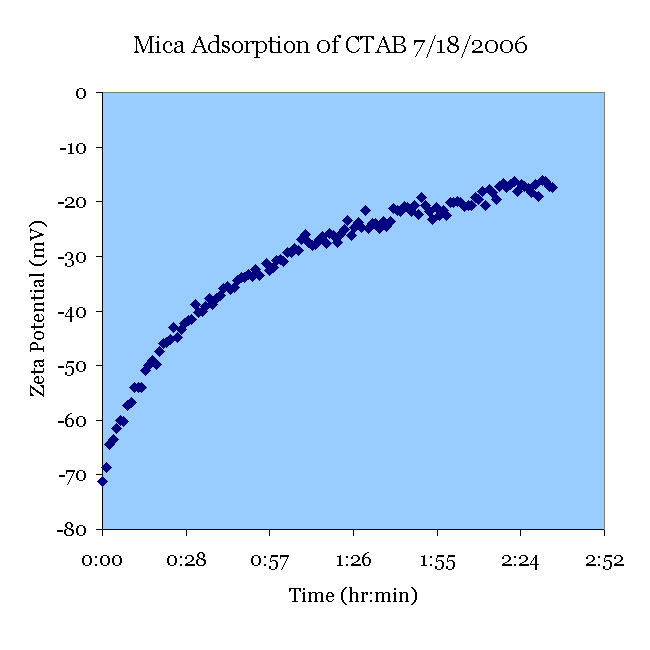
A fresh mica sample was pretreated in pH 11 KOH solution and tested in a 106 μS/cm KCl solution. CTAB was added to create a 2 μM CTAB solution. This suggests that a higher concentration of CTAB correlates to a more positive zeta potential.
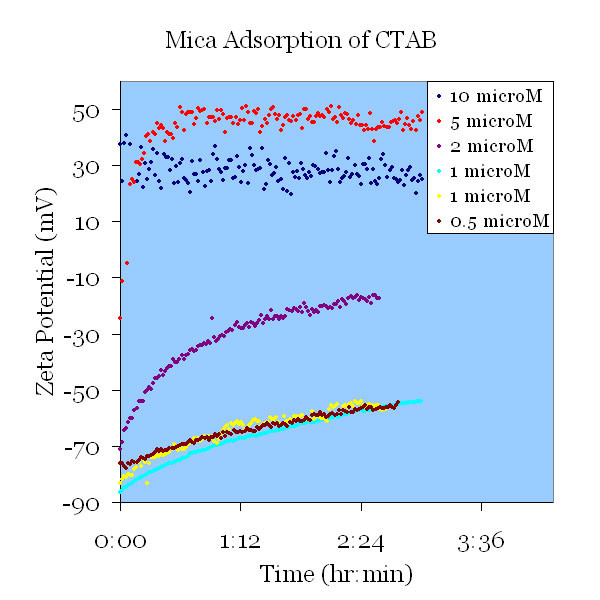
Fresh pretreated mica samples were exposed to 1mM KCl, pH= 5.5, containing various amounts of CTAB. At 1μM CTAB and below, the adsorption curves were indistinguishable. At 2 μM CTAB and above, substantially more CTAB was adsorbed. At concentrations 5μM CTAB and above, the CTAB stabilized bubbles entrained by the stirring, introducing noise in the data.
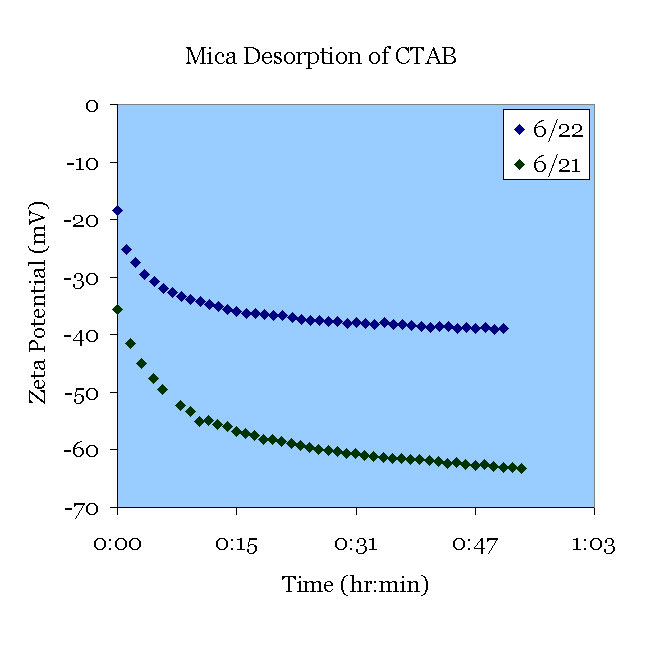
June 21st. A fresh mica sample was pretreated in pH 11.7 solution for 30 minutes and 1mM CTAB. The sample was than placed in 1 mM KCl (pH 5.5) that was initially free of CTAB. The CTAB desorbed.
June 22nd. A fresh mica sample was pretreated in pH 11 solution for 30 minutes and 1mM CTAB. The CTAB was then desorbed in the solution from June 21st. It is thought that the difference in zeta potential is due to the residual CTAB from the previous experiment.
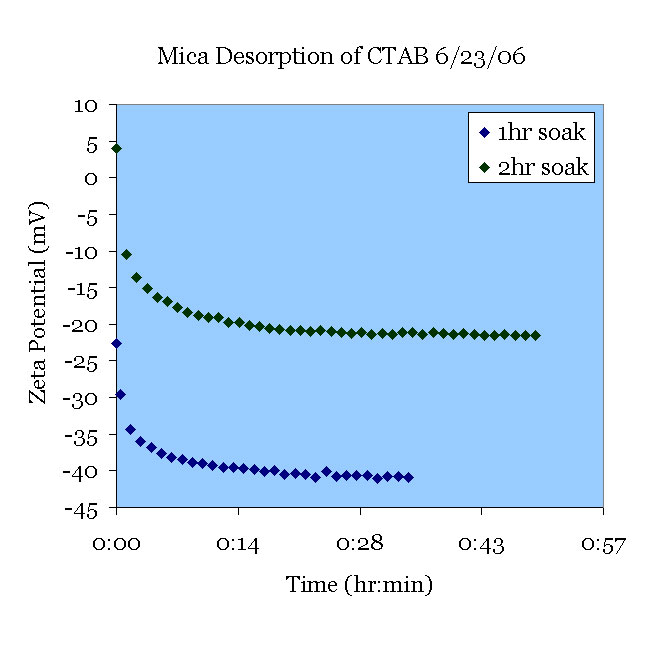
A fresh mica sample was pretreated in pH 11 solution (30 min.) and 1mM CTAB (1.5 hr). The CTAB was desorbed in 1mM KCl at pH 5.5. Another fresh mica sample was pre-treated in pH 11 solution (30 min.) and 1mM CTAB (2.5 hr). The CTAB was then desorbed in 1mM KCl from the previous experiment.